Amin Astaneh and Dan Sepich, Nobl9 2026-06-03
This live workshop guides you though defining, visualizing, and monitoring service level indicators(SLIs) and objectives for a make-believe production service, CatService.
At the end of the workshop, you will have practical experience in participating in SLO processes for a team as well as using Nobl9’s features.
This workshop is intended to be performed as a group of the following participants, however can be performed solo just fine:
Note: Instructions successfully tested on Ubuntu 24.04.
Download this zip file and extract it.
wget https://navitaire.slolab.xyz/navitaire-slo-workshop.zip
unzip navitaire-slo-workshop.zip
cd navitaire-slo-workshopPodman is the supported container runtime at Navitaire.
Follow the installation instructions from podman.io for your operating system.
To verify your installation is working, run:
podman run docker.io/hello-world
This workshop uses Podman Compose to simplify management of our lab environment.
You should be able to install
it directly on Debian or Fedora-based Linux distributions. Otherwise,
use Python pip.
The stack used for the exercise consists of the following components:
The file compose.yml is a Docker Compose file that
greatly simplifies setup for you. Simply run the following command to
launch the above services:
podman compose up -d
You should get output that looks like this:
$ podman compose up -d
>>>> Executing external compose provider "/usr/bin/podman-compose". Please refer to the documentation for details. <<<<

podman-compose version: 1.0.6
['podman', '--version', '']
using podman version: 4.9.3
** excluding:  set()
['podman', 'ps', '--filter', 'label=io.podman.compose.project=effective-slos-workshop', '-a', '--format', '{{ index .Labels "io.podman.compose.config-hash"}}']
['podman', 'network', 'exists', 'effective-slos-workshop_default']
...

exit code: 0
Run podman ps to confirm that your stack is running.
$ podman ps
CONTAINER ID  IMAGE                                        COMMAND               CREATED        STATUS        PORTS                   NAMES
6c84a349ea0d  docker.io/certomodo/catsvc:latest            gunicorn app:app      2 minutes ago  Up 2 minutes  0.0.0.0:5000->5000/tcp  effective-slos-workshop_catsvc_1
3c82803b6e1a  quay.io/prometheus/blackbox-exporter:latest  --config.file=/et...  2 minutes ago  Up 2 minutes  0.0.0.0:9115->9115/tcp  effective-slos-workshop_blackbox_1
5fe3c652571a  docker.io/prom/prometheus:latest             --config.file=/et...  2 minutes ago  Up 2 minutes  0.0.0.0:9090->9090/tcp  effective-slos-workshop_prom_1
14b1e3e78ff1 docker.io/grafana/grafana-oss:latest 2 minutes ago Up 2 minutes 0.0.0.0:3000->3000/tcp effective-slos-workshop_grafana_1Let’s try to interact with CatService to understand what it does:
$ curl localhost:5000
₍^.  ̫.^₎
That’s it! You make an HTTP request, you get a cat (for now).
Imagine that you are an engineering team tasked with defining SLIs/SLOs for CatService, a backend production system.
Let’s make believe that the following conditions are true:
As a group, collaborate on a document that contains a set of statements describing (from the user’s point-of-view) what is required for the service to function properly.
Try not to think about specific metrics or implementation details. The best statements are written in simple terms.
Make sure to collectively discuss and work to agreement on the statements written! That’s how SLOs are designed in real life!
# CatService
## What Does It Mean To Be Up?
### Last updated: 2026-06-03

## Owners
CatService is owned and operated by TEAM, with A as Team Lead and B as Product Owner.

## Service Description
CatService is a read-only HTTP service that provides ASCII art pictures of cats.

## User Expectations

When I request a cat picture...

- Statement 1
- Statement 2
- Statement 3When you use a search engine, consider what you expect from it in order to be useful.
When I search for something, I should:
Using the “What Does It Mean To Be Up” document, collaborate on a new document describing the aspirational SLIs/SLOs.
For each statement in the previous document, define an SLI for each.
Consider: if you had all of the engineering time and observability budget you needed, what would you want to measure, and how?
Remember that SLIs should include:
Next, try to define aspirational SLOs for your set of SLIs. Consider the following as a group:
# CatService — Aspirational SLIs and SLOs
*Last updated: 2026-06-03*

---

## SLI Definitions

Based on our two user expectations in our "up" definition document.

### SLI 1 — ABC

> The specific measurement that describes ABC.

A successful ABC is defined as: this specific data point in your time series or logs.

Failures are: any other data point.

SLI = (success) / (total)

---

## Aspirational SLO Targets

| SLI | Target | Window |
|-----|--------|--------|
| ABC | 90% | 30 days rolling |
| ... | ... | ...|

### Why these numbers?

**ABC — >= 90.00%**
This is the explanation why 90% is a valid aspirational SLO.
If you’re struggling with this task, don’t worry! At the end of this section, we’ll show you our examples that you can use for the next steps, if you wish.
Now that we have aspirational SLIs/SLOs defined for CatService, let’s see what metrics we can gather from it so that we can build the first version of our SLIs.
At the moment, CatService doesn’t have any logging enabled, and metrics gathered from the service directly would not replicate the actual customer experience. What if:
Therefore, you decide to generate synthetic traffic to CatService every 15 seconds and store the results of the requests to generate SLI data.
Lucky for us, we have an already-running Prometheus instance as well as the Blackbox Exporter, which we can use to make requests to CatService and store information about performance and availability over time.
(Note: This is a very simple implementation for the sake of this workshop. In a real-world example, storing and analyzing request logs from the backend in addition to storing results from synthetic traffic would be a more comprehensive approach.)
In prometheus.yml, add the following job to the bottom
of the file:
- job_name: urlmon
    metrics_path: /probe
    params:
      module: [http_2xx]
    static_configs:
      - targets:
        - http://catsvc:5000
    relabel_configs:
      - source_labels: [__address__]
        target_label: __param_target
      - source_labels: [__param_target]
        target_label: instance
      - target_label: __address__
        replacement: blackbox:9115
Simply put, we are telling the Blackbox Exporter running on port 9115
to query CatService using the http_2xx module. For
additional information, see the project’s
README.
With that change made, apply it to our stack with
podman restart navitaire-slo-workshop_prom_1, which should
restart the Prometheus container.
At this point, our observability stack (Prometheus) via the Blackbox Exporter should contain metrics for CatService. Let’s use our Grafana instance as a frontend for Prometheus and investigate what metrics we can use to build queries against to create our SLIs.
Head to the Grafana interface and
login with default creds admin:admin.
Grafana is pre-configured with our Prometheus instance as an available data source.
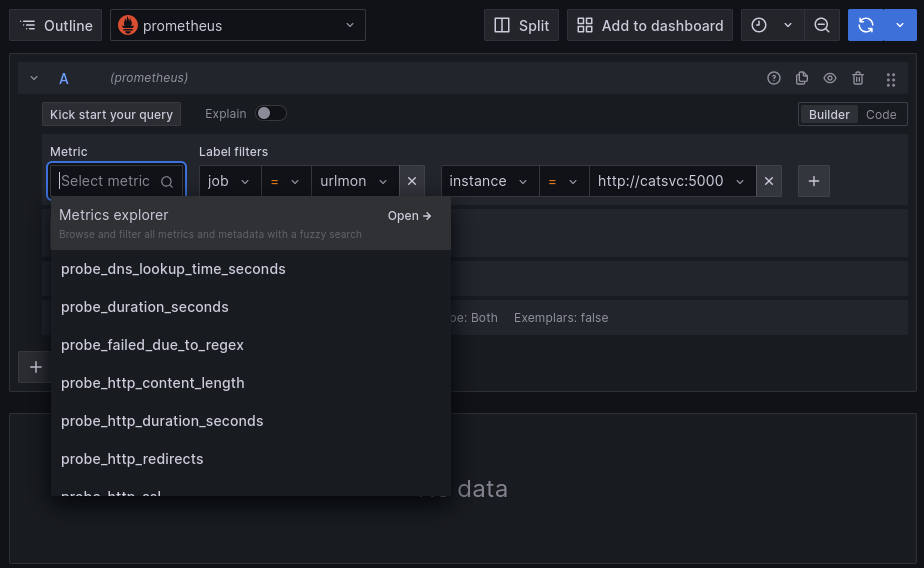
Let’s begin to query our CatService data. Click the Explore tab on the left, make sure that Prometheus is selected as the data source, then set the following label filters in the query builder:
Then click on ‘Select metric’ and see the options available in the dropdown. These are all of the timeseries that blackbox_exporter is collecting for us.
Select each of them and click ‘Run Query’ in the top right to visualize them.
Which metrics can be used to calculate our SLIs? Suggestions obfuscated below.
Hint: Metrics Explorer explains what each metric means.
probe_duration_seconds
probe_http_status_code, probe_success
We have the raw metrics suitable for our SLIs, but we will need to perform transformations on them to get our SLI values, so let’s continue in the Explore tab.
Let’s start with our Latency SLI first. We will use
probe_duration_seconds using metrics from the past 7 days,
but how do we perform the data transformation?
We can click the “+ Operations” button and further construct the query in this fashion. What query do you end up with?
If you wanted to calculate the 95th percentile of latency over the past 7 days, you could do this:
quantile_over_time(0.95, probe_duration_seconds{job=“urlmon”,
instance=“http://catsvc:5000”}[7d])
If you instead wanted to calculate the number of requests that completed within 100ms divided by total number of requests, you could do:
count_over_time((probe_duration_seconds{job=“urlmon”,
instance=“http://catsvc:5000”} < 0.1)[7d:]) /
count_over_time((probe_duration_seconds{job=“urlmon”,
instance=“http://catsvc:5000”})[7d:])
Similarly, how do we perform the data transformation to calculate
Error Rate, using the probe_success metric?
Error Rate = 1 - Success Rate1 - avg_over_time(probe_success{job=“urlmon”,
instance=“http://catsvc:5000”}[1w])
Now that we have built our SLIs in our observability platform, it’s time to prepare Nobl9 to use them.
First, sign in to Nobl9.
Click Catalog, go to the Projects tab, and click “Create Project”.
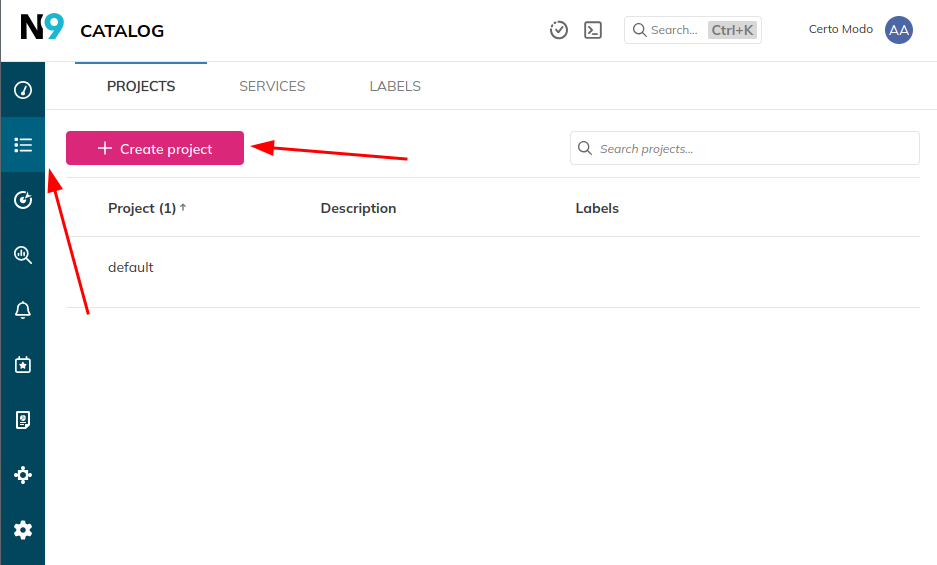
Fill out the form, setting “Display name” and “Name” to
test-lab-TEAMNAME, where TEAMNAME is a unique name for your
team for this exercise. Click “Create Project”. 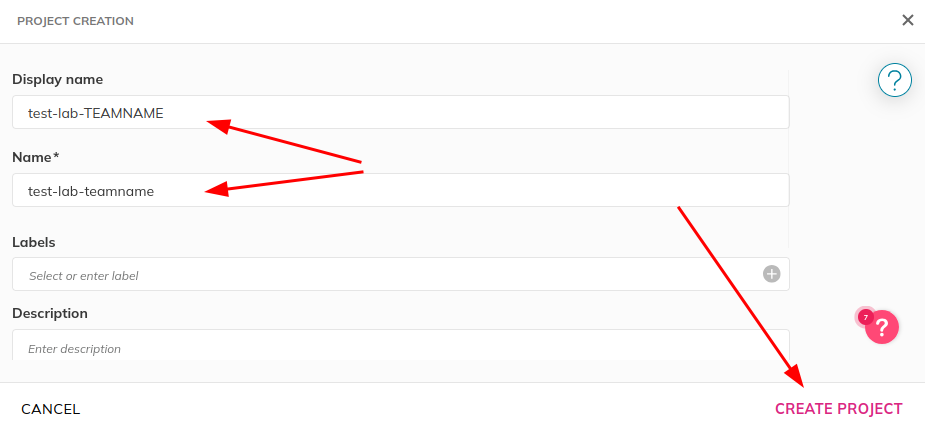
Let’s also create a Service in Nobl9 for our SLOs to be grouped under.
Go to Catalog -> Services -> Add a Service.
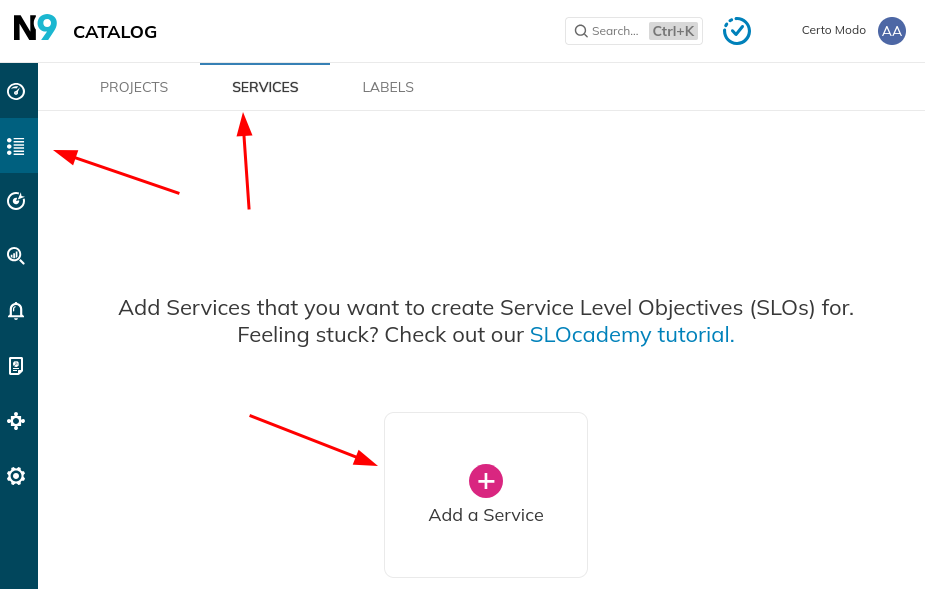
In the configuration dialog, provide the following options:
Click Add Service.
Finally, we need to run the Nobl9 agent in our environment to scrape SLI metrics from Prometheus as a data source.
Go to Integrations -> Add a Data Source, then select Prometheus, then Agent.
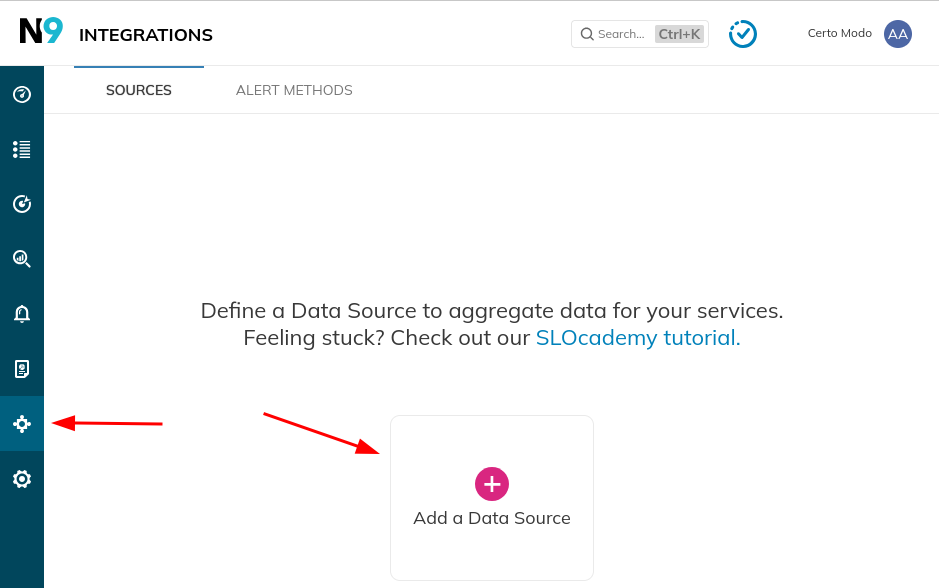
In the configuration dialog, provide the following options:
Click “Add Data Source” on the bottom-right.
You will be taken to the details page for the Prometheus datasource.
Select Docker and take note of the environment variables, container
name, and version of the Nobl9 Agent provided in the
docker run command.
Edit compose.yml and uncomment the following on the
bottom of the file:
  nobl9-agent:
    restart: on-failure
    container_name: nobl9-agent-catsvc
    environment:
      - N9_CLIENT_SECRET=<GET_FROM_UI>
      - N9_METRICS_PORT=9090
      - N9_CLIENT_ID=<GET_FROM_UI>
    image: nobl9/agent:<GET_FROM_UI>
Then, supply the information from the details page.
Finally, run podman compose up -d to launch the Nobl9
Agent.
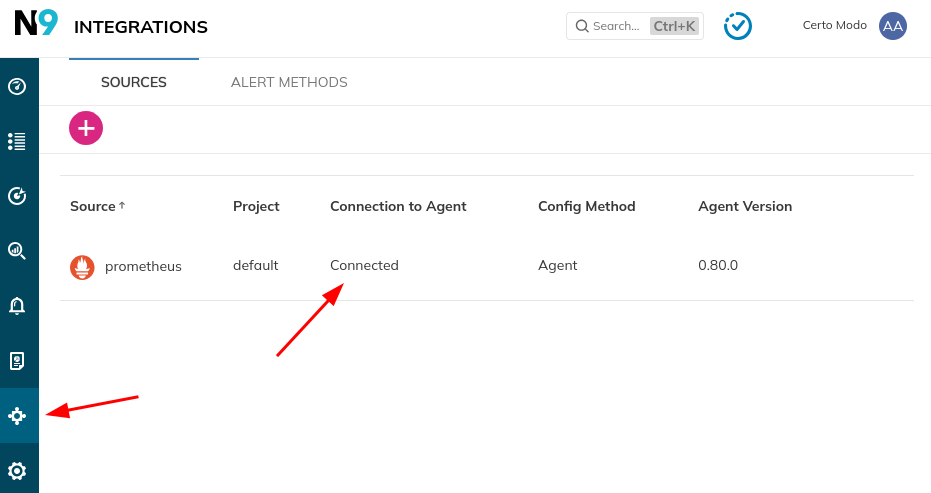
Return to the Integrations page to confirm that the Agent is working properly.
At this point, Nobl9 is ready for us to create our first set of SLOs.
The SLI Analyzer tool enables us to retrieve SLI data from our data source and then help choose an initial SLO value based on actual performance rather than sentiment.
Click “SLI Analyzer” -> “Create Analysis”. 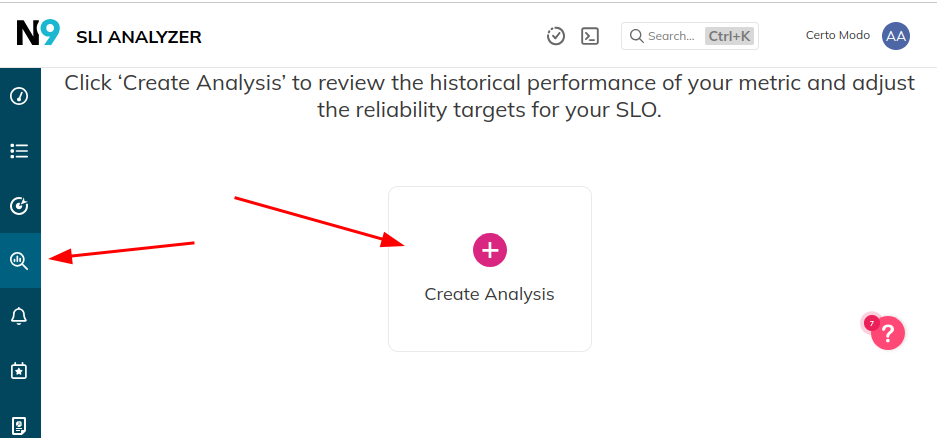
On the right hand side, specify the data source, an SLI query from the previous sections, and the graph time window- then click “Import Data”. This process will take a few minutes.
Note: Threshold metric takes a single query that you
will apply a threshold to in distingushing good vs bad values. Ratio
metric in contrast requires two metrics for
(good) / (total).
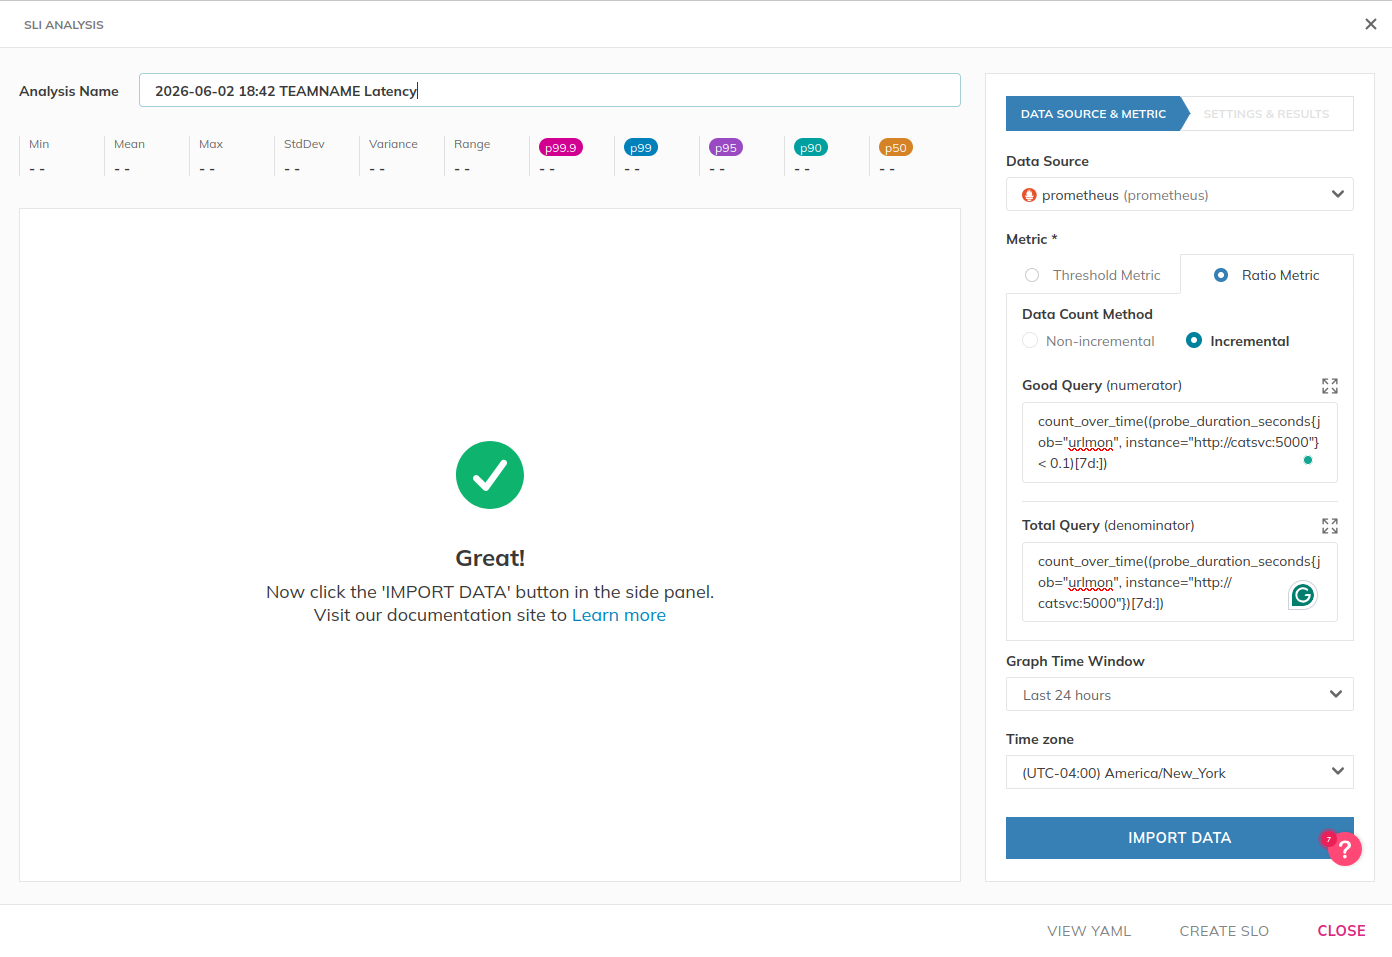
The UI will update with graphs and a statistical breakdown of the SLI performance. Then, on the right hand side, you can test SLO values by specifying a target and clicking Analyze.
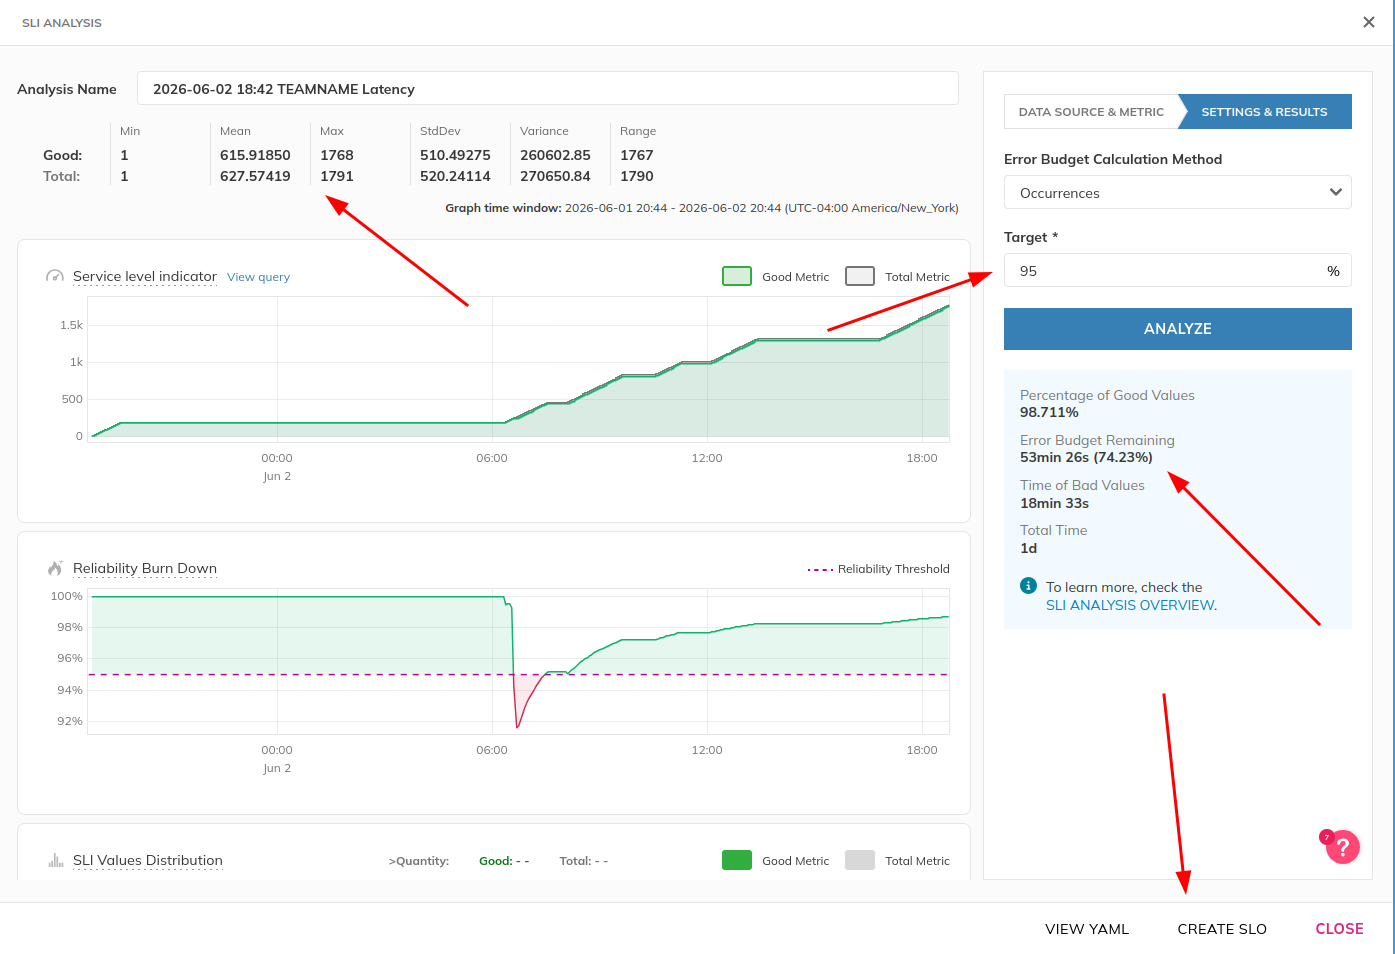
Collaborate with the group on what the initial SLO value should be based on the UI results.
Ideally, performance regressions should measurably consume error budget, but not completely.
Then, click “Create SLO”.
Select the Service you want to attach this SLO to (eg,
CatService-TEAMNAME) 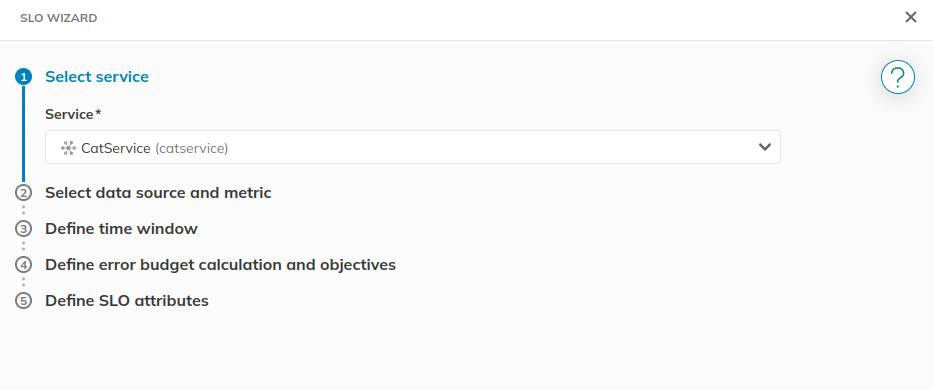
Specify how far back you want to retrieve metrics data via “Period
for historical data retrieval.” Note that the SLI queries have been
filled out for you. 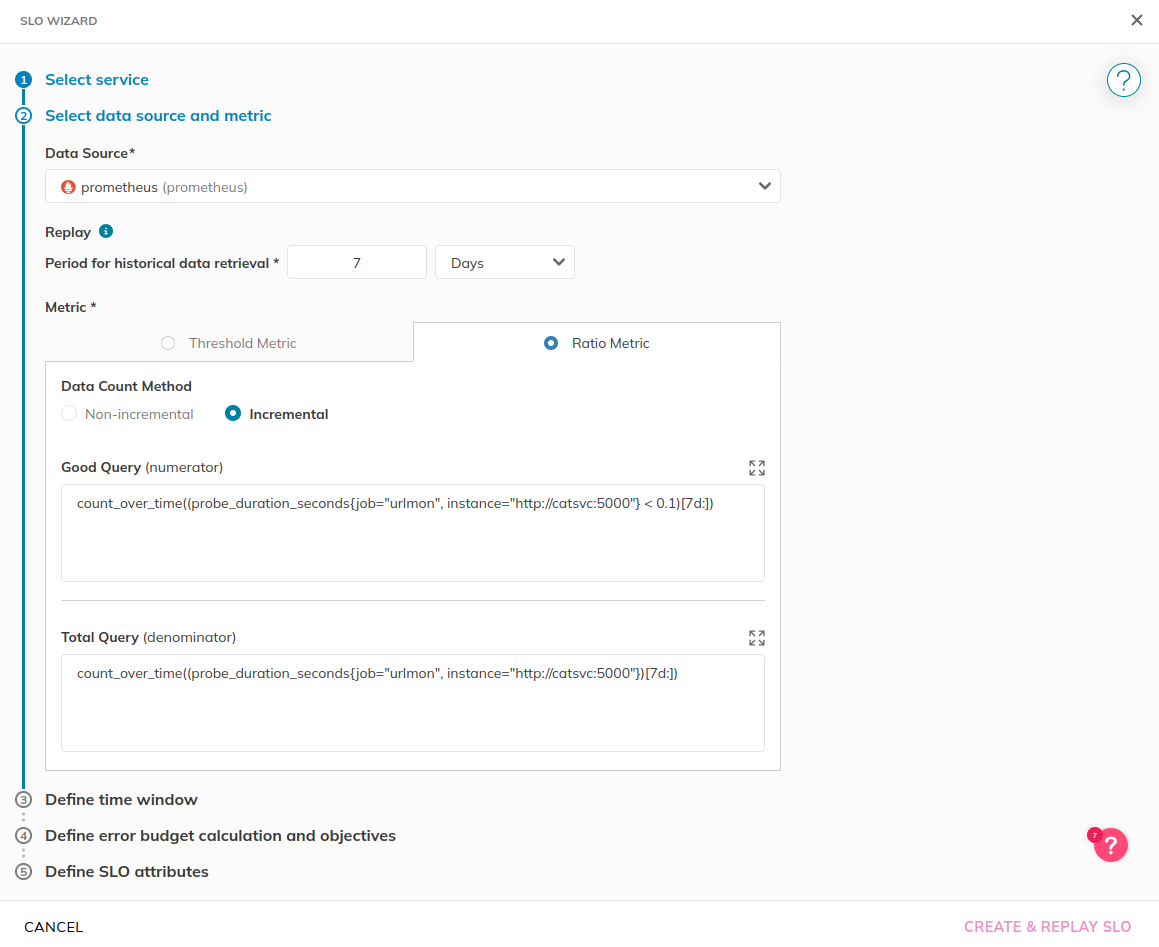
Specify the time window to calculate the SLO with. Typically we go
with the length of a team’s sprint, but lets set 7 days. 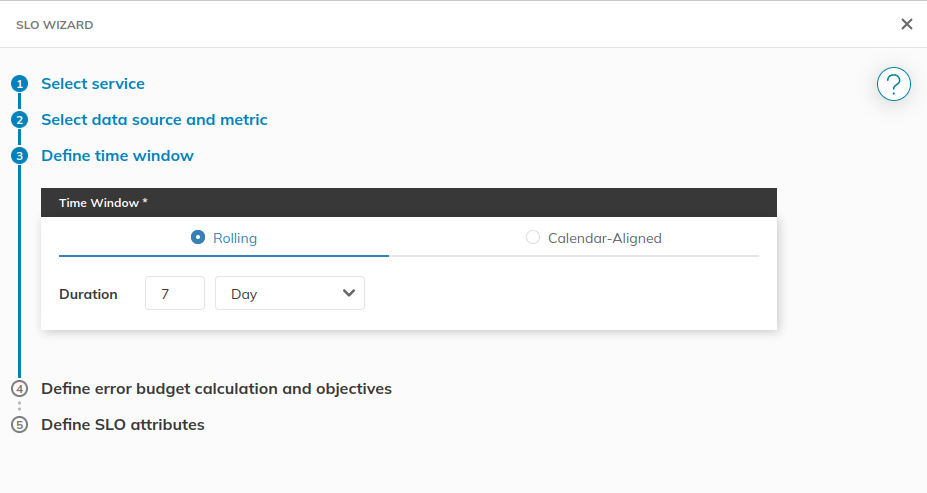
Set the name and confirm the SLO value. 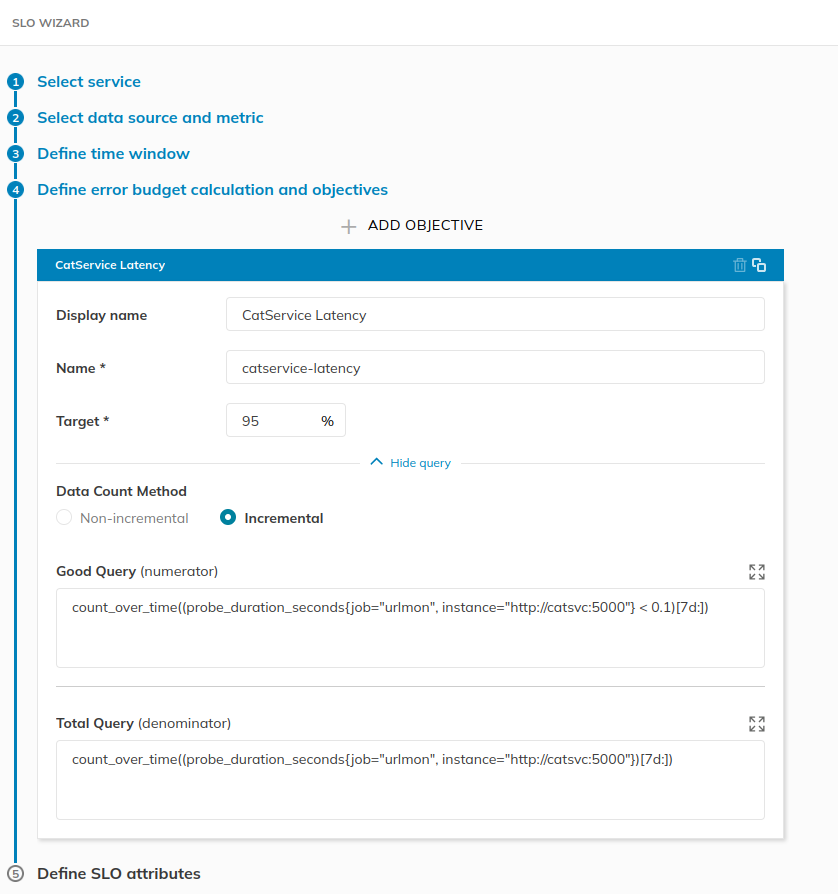
Finally, set the SLO name and display name. Don’t worry about
alerting configurations, we’ll set that later. 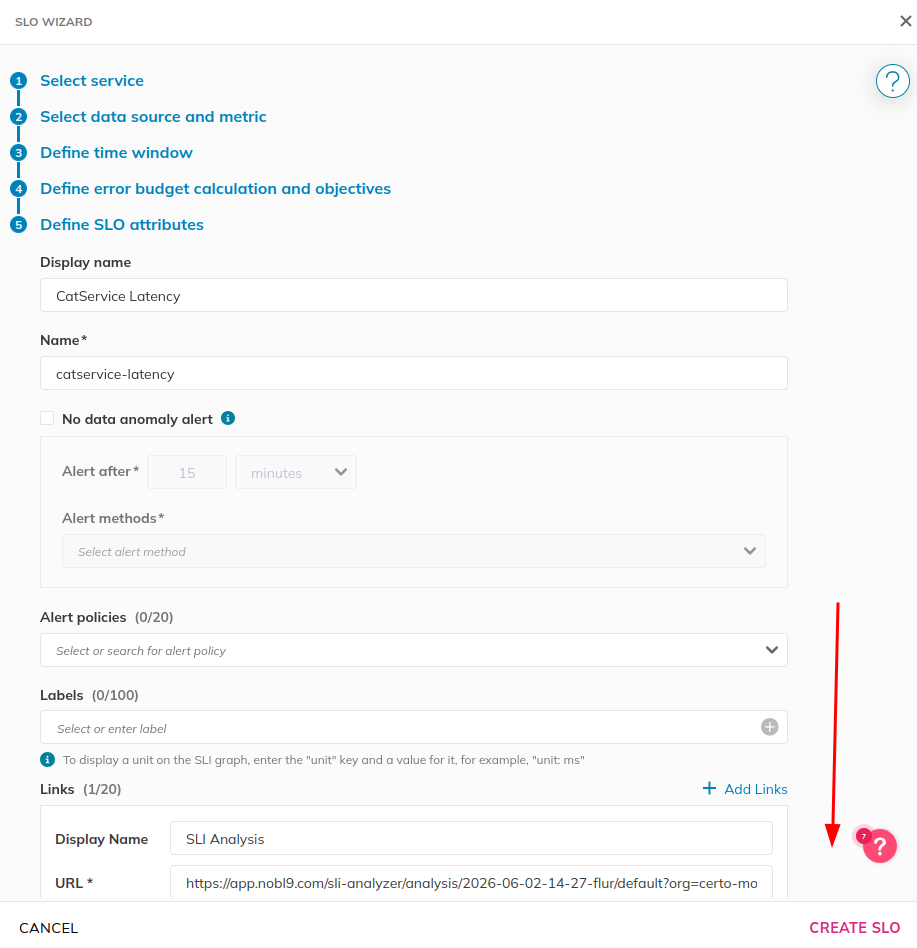
Click “Create SLO.”
You will now see your first SLO in the UI. Congrats! 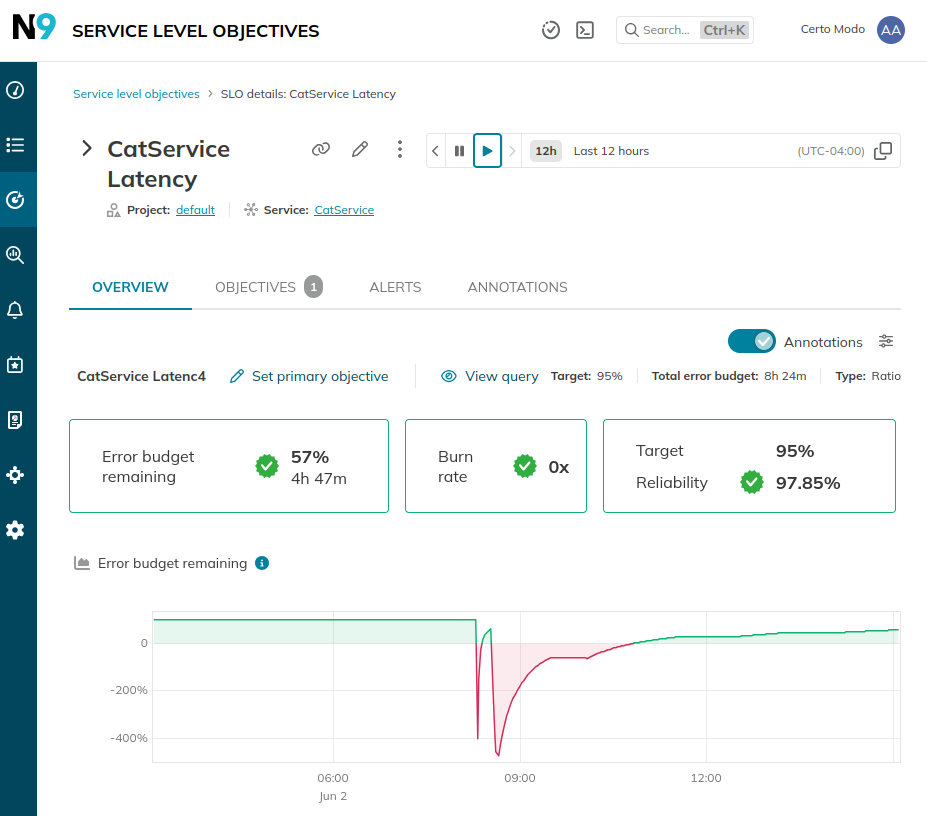
Repeat this process for every SLI that you have prepared from the previous steps.
sloctlWhile it’s really useful to define SLOs using Nobl9’s web UI, we can
do even better by defining them in YAML and applying them with the
sloctl tool. This enables:
Let’s demonstrate the basics of sloctl by exporting our
SLOs into YAML, modifying them, and then updating them using the
tool.
First, follow Getting started with
sloctl to download, install, and configure sloctl.
If properly set up, you should be able to view your current SLOs in YAML format:
$ sloctl get slos
- apiVersion: n9/v1alpha
  kind: SLO
  metadata:
    displayName: Success Rate

...
Now, run the command again, but direct the output to a file:
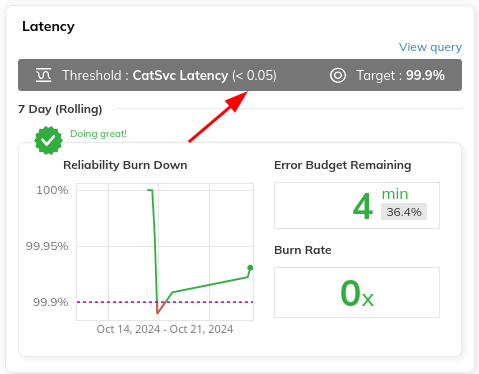
$ sloctl get slos > slos.ymlUsing a text editor, modify our Latency SLO where 99.9% of all requests must be served under 50 milliseconds.
Once done, apply our changes:
$ sloctl apply -f slos.yml
Applying 2 objects from the following sources:
 - /home/user/effective-slo-workshop/slos.yaml
The resources were successfully applied.
Load up the SLOs tab in the Nobl9 UI, and you should see the updated SLO:
At this point, we have a dashboard with some SLOs on them!
It will allow us to periodically do a manual review of performance, but we don’t want to stare at the dashboard all day to tell us if something is wrong.
Ideally, we want to be notified if one of the two conditions happens:
Let’s learn how to use Nobl9’s alerting features.
Go to Integrations -> Alert Methods -> Add Alert Method. 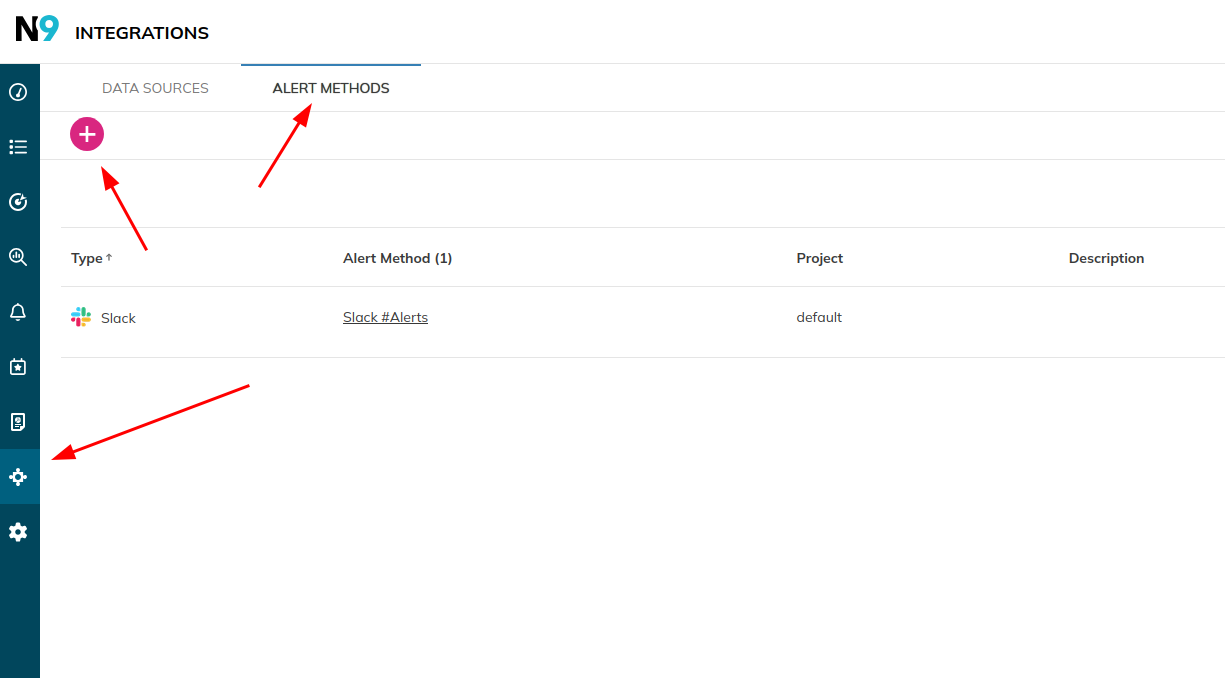
Nobl9 supports a large set of notification methods, including
webhook, allowing for fully-customizable integration into your workflow
or incident management system. For this example, let’s use plain old
email. 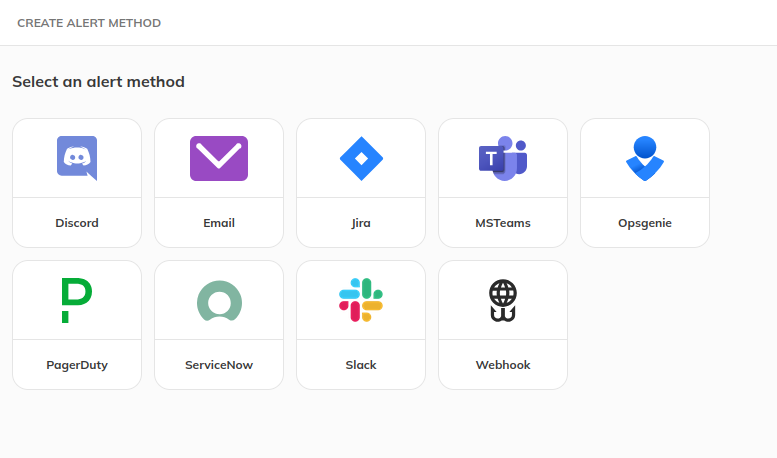
Specify your project, display name, and a set of email addresses to
route the alerts to. 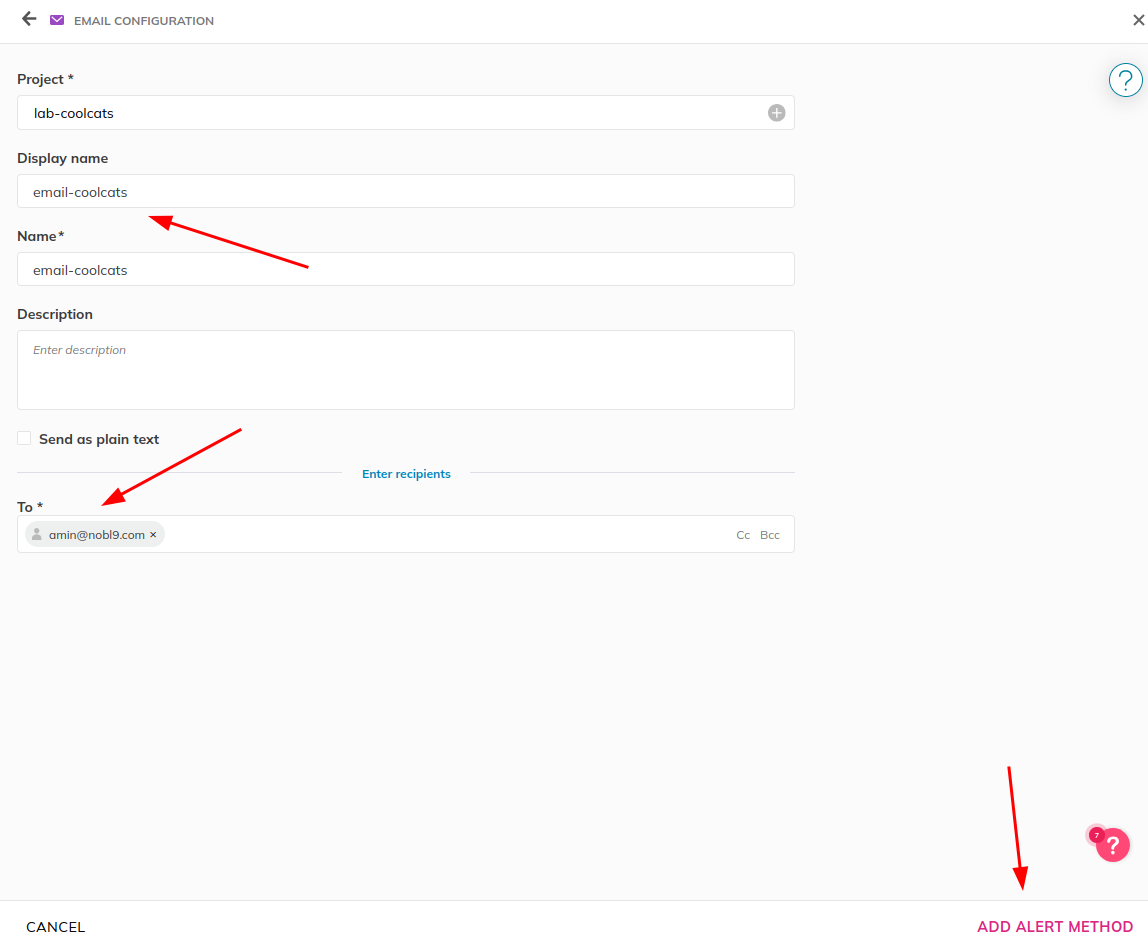
Now that we have an alerting method, let’s create a set of rules for which alerts should be sent.
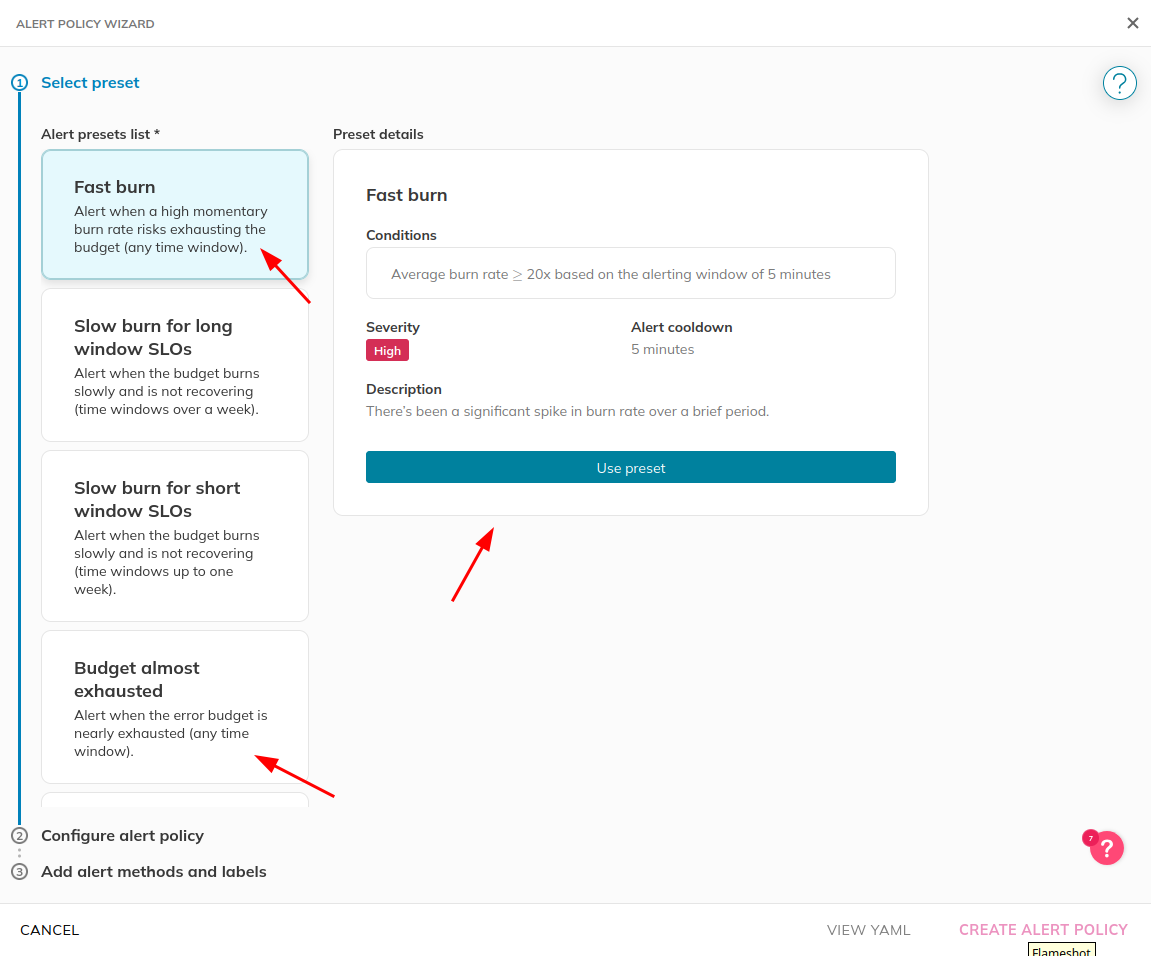
Go to Alerts -> Alert Policies -> Add An Alert Policy.
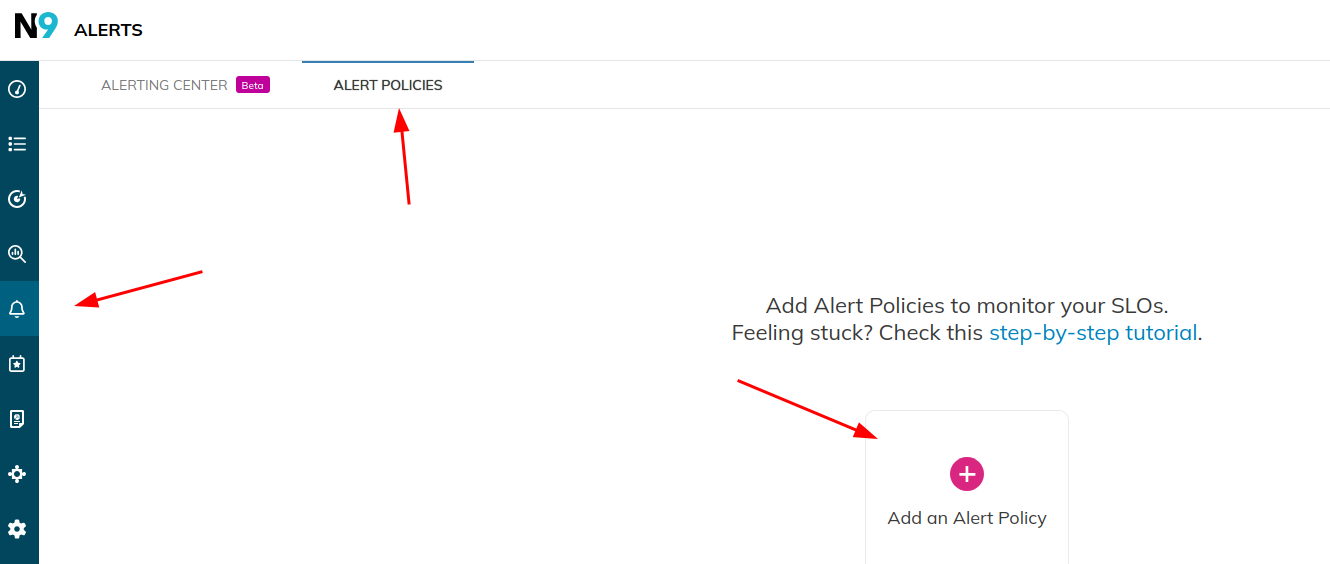
We provide pre-built templates for you to choose from. Let’s use Fast Burn in this example.
Specify project and display name: 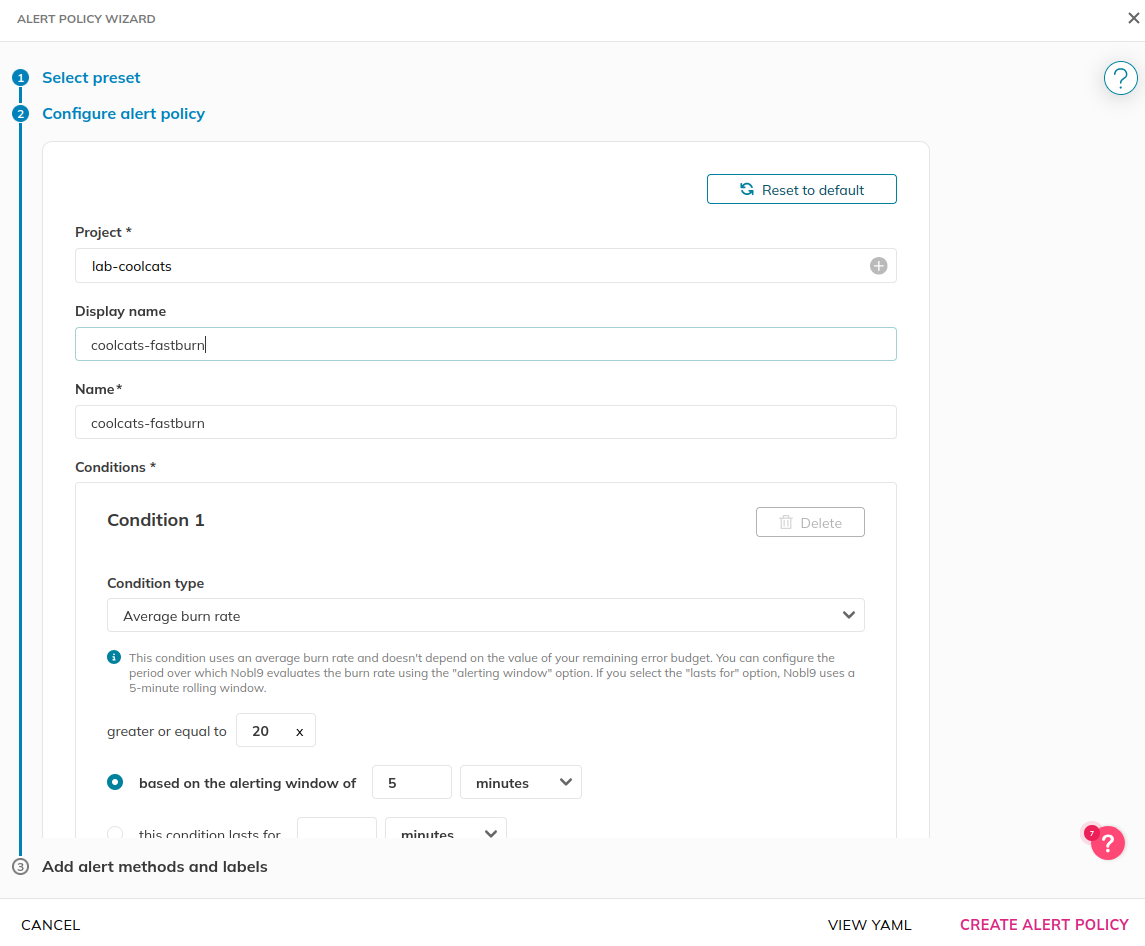
And configure it to use our alert method: 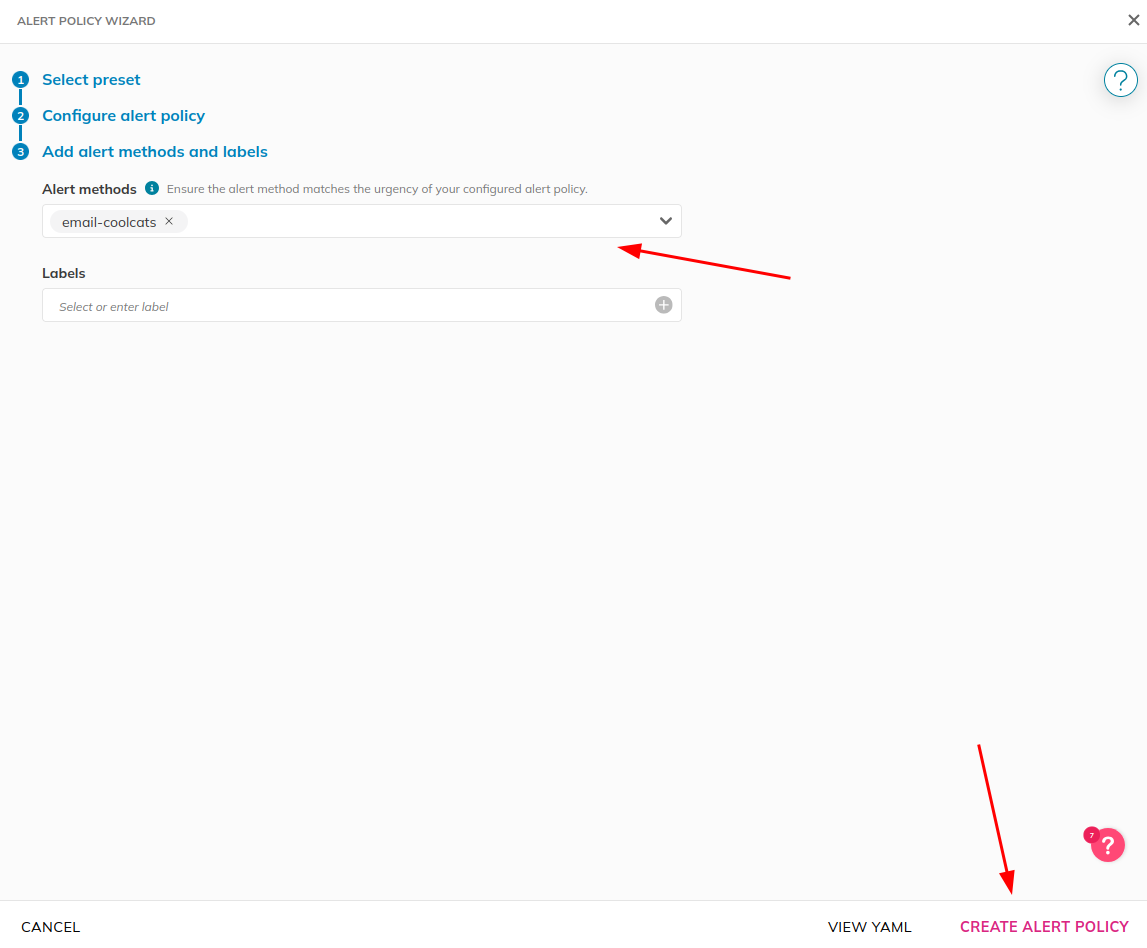
Let’s revisit our SLO(s) and add them to our alerts policy.
Go to Service Level Objectives, find your SLO, and click Edit.
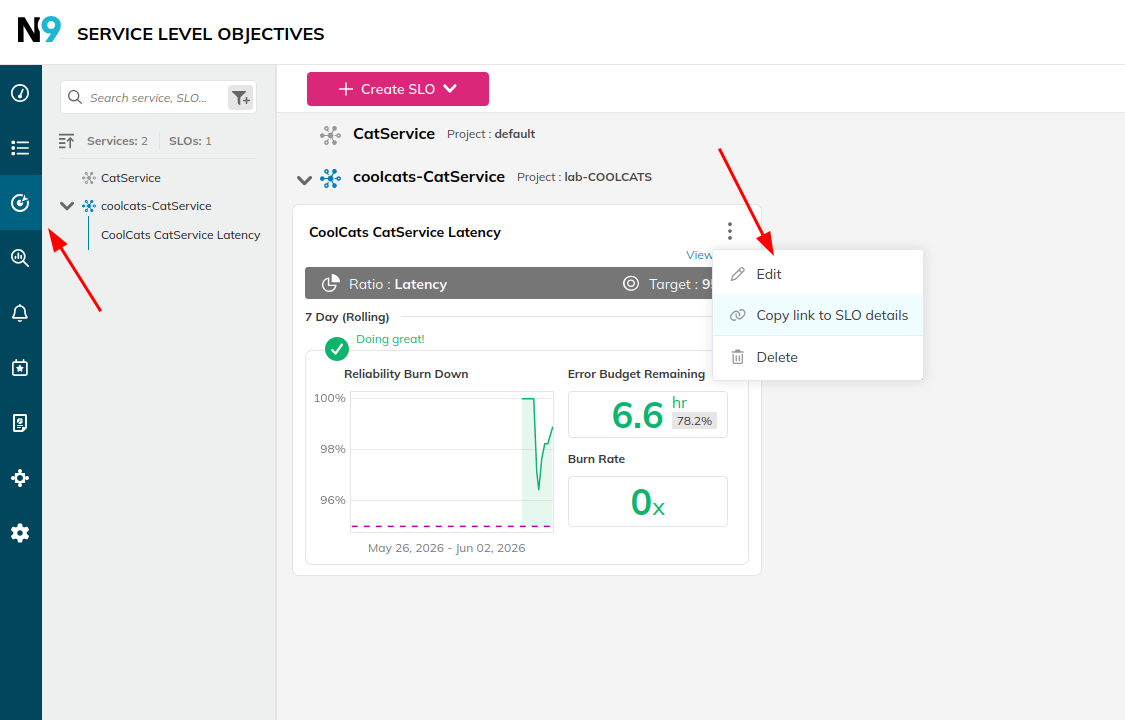
Go to “Define SLO Attributes”, specify the alert policies to apply, then click “Save SLO”.
Ok, so we have a dashboard for CatService’s SLIs/SLOs but since this is a local test environment, the performance is pretty consistent.
Let’s change that!
CatService allows you to configure its latency and error rate to simulate production incidents.
Modify compose.yml and add the following to the catsvc
entry:
    environment:
      - FLASK_ERRRATE=0.25
      - FLASK_LATENCY_MAX=1000
This will:
Restart CatService with:
podman compose up -d
Try to interact with CatService again using curl several
times. You will eventually see errors in a subset of your requests, and
will see cats load more slowly!
$ curl localhost:5000
Internal Server Error(Simulated)
Over time, you should see the SLI performance change to meet and then exceed the SLO error lines. Similarly, error budget percentages should go to zero and then into the negative!
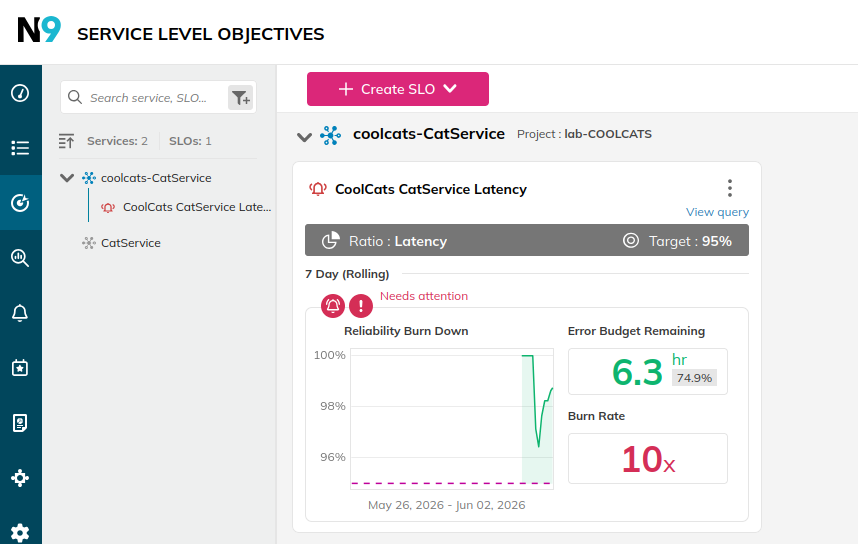
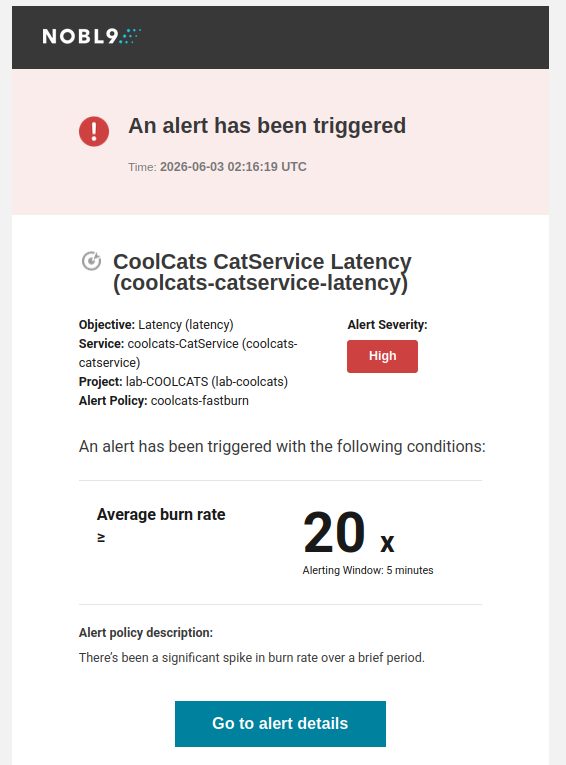
You’ll also get an alerts notification in your mailbox:
Note: you may see large negative error budget
values. The reason is that you don’t have a week’s worth of
data points yet, so this simulated incident spent the error budget very
quickly! If you undo your change and run
podman compose up -d again, the error budget will quickly
replenish (at least in the case of latency).
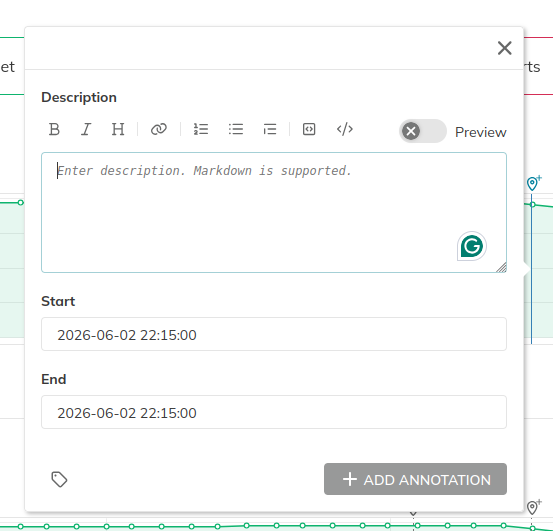
To help make meaning of past events regarding SLO performance, you can add comments (called annotations) to SLO graphs at a specific moment in time.
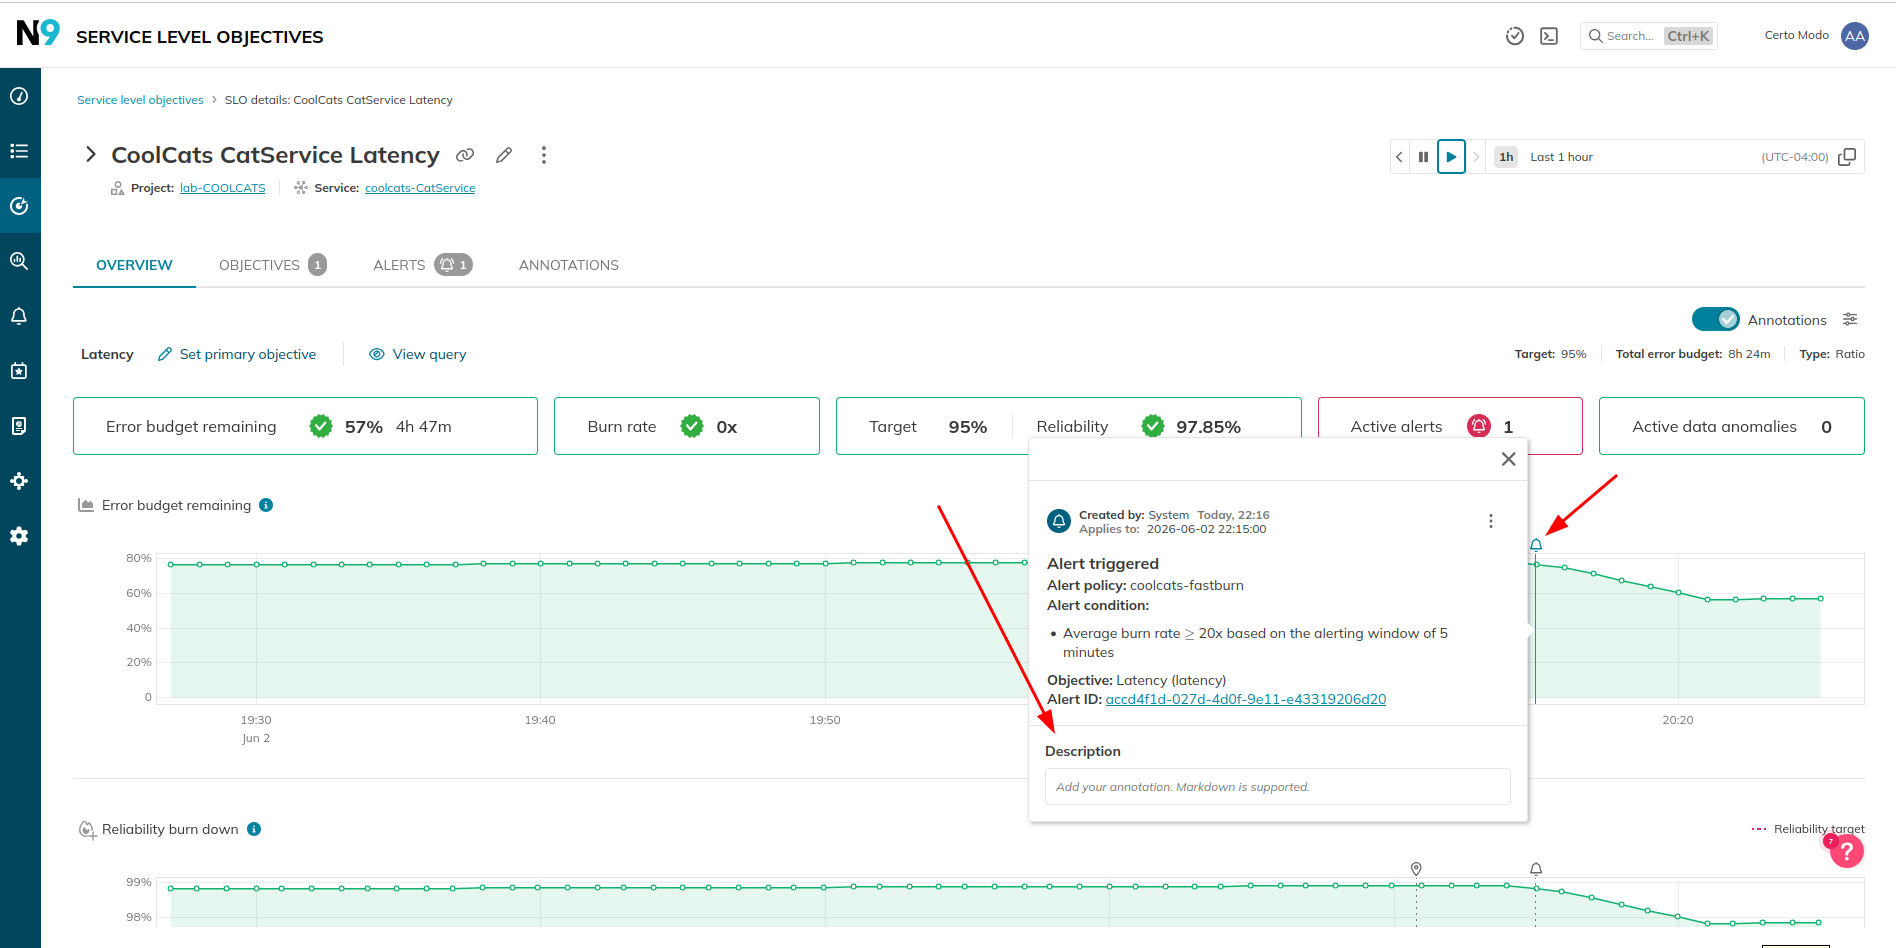
Annotations are created automatically for SLO updates and alerts. You can then add comments to them to help explain specifics.
Protip: You can create/manage annotations using the Nobl9 API. See API reference.
When you’re done experimenting with this environment, run:
podman compose downThis will stop all of the containers and remove all of the resources, including storage.